This is a second part of Basics of GIS Systems topic. If you didn’t read the first part - I recommend to start here
In this part let’s talk about projections, scales and resolutions.
Projections
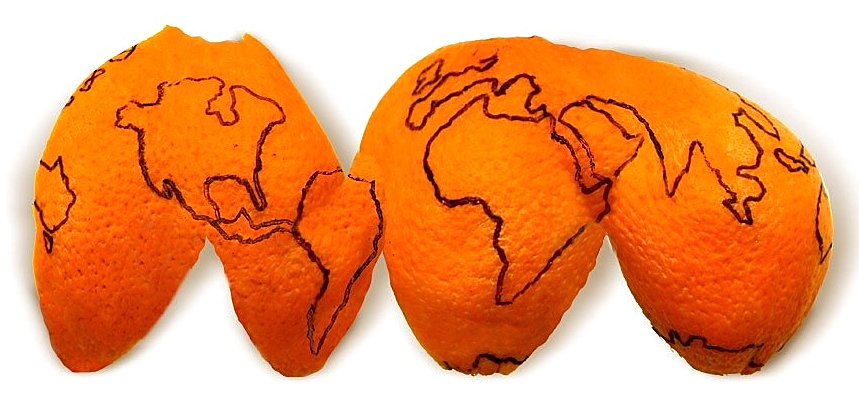
Projections refer to how we translate what’s on the curved surface of the earth to a flat, 2 dimensional space, and in the case of GIS software it means how we represent map data from the spherical earth on the digital flat screen.
There exists a lot of different types of projections to represent globe on a screen, but why not using only one?
Because translation of 3D sphere on a 2D screen is affected by different types of distortions and it’s not possible to preserve all these properties at once:
- area
- scale
- shape
- direction
For example the most common type of projection used in digital maps are projections which preserve angles and it’s called Mercator projection, but disadvantage is that this projection has distortions in areas of surfaces. Mercator projection is a part of cylindrical family projection.
I will not dive too much into details of this topic, if you want to learn about projection families etc I recommend to read this article
Just FYI in Open Layers the default map projection is Web Mercator with code EPSG:3857. EPSG stands for European Petrolium Survey Group who standardized projections in EPSG codes. These codes are commonly used in open source libraries like Open Layers.
You can always define projection to work with which better fit your needs. But how to choose the right one? Well, It depends. If you work on specific country, the most common is to use national projection for this country. For example on my current work project for France Metropolitaine we using lambert 93 projection with code EPSG:2154, but for overseas France islands we use another projections.
If you need to find EPSG code for some projection, you can reference to website epsg.io
Coordinates Reference System (CRS)
When working with maps, we need to identify objects accordingly to their real positions on the earth. The most common known way to do it is thanks to geographic coordinates with degrees as units : latitude and longitude, or more officially known as WGS84 datum or EPSG:4326 projection (pretty much the same thing).
Another way to describe coordinates is with metric projection. For example it is the case for Web Mercator projection with use of meters as unit to describe position instead of longitude/latitude.
So if you have a coordinate point in longitude/latitude degrees and you want to visualise it on a open layer map which measure distances in meters, you should do a transform operation from projection EPSG:4326 (degrees) to default EPSG:3857 (meters), otherwise the coordinate will not be in a correct place on a map.
You can refer to this official OpenLayers Guide to better undestand this translation.
Ok, enough for projections, let’s move on on resolutions and scales. There will be some maths to understand but don’t worry it’s ok! 
Resolution and scale
The term of resolution is used in software and in our case applied mostly to the gis raster data. It describes a relation between 1 pixel on the screen and units of projection
In the case of metric projection (ex. EPSG:3857) resolution is a number of meters per screen pixel.
In the case of degree projection (ex. EPSG:4326) resolution is a number of degrees per screen pixel.
The important thing to remember here is that approximately 1 degree = 111139 meters. So we can convert resolutions between projections of different units types.
By the way if you don’t know your projection units, you can refer to epsg.io website and search for your projection detailed explanation.
For simplicity let’s continue on exemple of metric projection.
Resolution depends on current zoom of your map: if map is zoom out, 1 pixel represents bigger distance, then when zoom in. So if I tell you that resolution is 35.5 that means that 1 pixel screen correspond to 35.5 meters of ground.
With zoom in, resolution value decrease and with zoom out resolution value increase.
Scale is another term related to resolution but from real physical world. Scale is what you often can see on the bottom of paper maps. For example 1:20000 means that 1cm of paper map representing 20000cm of ground size or that 1cm map = 200m earth.
We can convert resolution to scale and vice versa using what’s called screen resolution. It is possible, because we can mesure 1 pixel of our digital screen in inches: physical world unit.
Let’s pretend for our example that screen resolution is 96 pixels by screen inch (96dpi or 96 dots per inch)
Let’s do now some basic math and find out scale for resolution 35.5 from previous example:
We know that 1 inch equals to 2,54cm. It also means that 1 inch = 2,54/100 = 0,0254m (as 1m = 100cm).
So 1m = 1/0,0254 inchesWe also know that 1 inch contains 96 pixels (96dpi) on screen.
For resolution 35.5, 1 screen pixel = 35.5 ground meters. Then for 1 inch it will be 96 times more (96dpi) and equals to 35.5 x 1 inch = 35.5 x 96 pixels = 3408 ground size meters. Or 3408 * 1/0,0254 = 137581 inches.
Now we have relation: 1 digital screen inch = 137581 ground size inches, otherwise the scale equals 1:137581 when resolution is 35.5
But there is a catch! This works in metric projection as resolution expressed in metric units. In case of degree projection, the resolution will be in degrees units (111139 meters per degree unit). So 35.5 metric resolution will be 35.5/111139 = 0.0003194 for same scale.
So if we want to express scale from our physical world no matter projection, we should multiple the result by number of meters per projection unit.
Here’s the complete formulas to calculate scale-resolution transformation:
Scale = (0.0254/(resolution * dpi)) * MPU
Resolution = (0.0254 * MPU) / (dpi * Scale)
where MPU is projection relation of METERS PER UNIT.
Resolution Grid
In OpenLayers we refers to maxResolution to describe resolution constraint when zoom out on map, and minResolution to describe constraint when zoom in. These constraints restrict min/max zoom that user can apply on map.
It’s the opposite for scale: we said minimum (or small) scale when zoom out (for 1:10000 ) and maximum (or large) scale for 1:5000 (when zoom in).
This relation between scale and resolution is important, because most of the time we as humans refers to zoom in terms of scale (for exemple for Map UI zoom bar with values like 1:5000, 1:2000 etc), but gis software as OpenLayers makes calculations in terms of resolutions, so we need to do these transformations.
Practically in OpenLayers when we define range of possible zoom levels on your map view we can refer to so-called resolution grid to restrain possible zoom levels.
Here’s an exemple of resolution grid for 96dpi and metric projection.
RESOLUTIONS_GRID = [
  //  res             level  scale @96.0 DPI
  264.5838625010584,  // 0:  1000000.00000000
  132.2919312505292,  // 1:  500000.00000000
  66.1459656252646,   // 2:  250000.00000000
  26.458386250105836, // 3:  100000.00000000
  13.229193125052918, // 4:  50000.00000000
  5.291677250021167,  // 5:  20000.00000000
  3.9687579375158752, // 6:  15000.00000000
  2.6458386250105836, // 7:  10000.00000000
  1.3229193125052918, // 8:  5000.00000000
  0.9260435187537043, // 9:  3500.00000000
  0.5291677250021167  // 10: 2000.00000000
]RESOLUTIONS_GRID = [
// res level scale @96.0 DPI
264.5838625010584, // 0: 1000000.00000000
132.2919312505292, // 1: 500000.00000000
66.1459656252646, // 2: 250000.00000000
26.458386250105836, // 3: 100000.00000000
13.229193125052918, // 4: 50000.00000000
5.291677250021167, // 5: 20000.00000000
3.9687579375158752, // 6: 15000.00000000
2.6458386250105836, // 7: 10000.00000000
1.3229193125052918, // 8: 5000.00000000
0.9260435187537043, // 9: 3500.00000000
0.5291677250021167 // 10: 2000.00000000
]Resolution grid should be used when we create initial View for our Map. For example
new View({
    center: getCenter(getProjectionExtent(proj)),
    extent: getProjectionExtent(proj),
    zoom: 6,
    projection: `EPSG:${projection}`,
    resolutions: RESOLUTIONS_GRID,   <-- your grid here
    constrainResolution: true
  })
new View({
center: getCenter(getProjectionExtent(proj)),
extent: getProjectionExtent(proj),
zoom: 6,
projection: `EPSG:${projection}`,
resolutions: RESOLUTIONS_GRID, <-- your grid here
constrainResolution: true
})Conclusion
That’s all! Thanks you for reading and I hope you learned something new 
I think it was enough theory and the next time we will start to apply the knowledge to create basic map in browser and move to more advanced concepts gradually.
Sources
https://bookdown.org/michael_bcalles/gis-crash-course-in-r/
https://enonline.supermap.com/iServer9D/Appendix/scale.htm