This is a first part of a series of articles about GIS and Open Layers library.
I like to build my knowledge from basics to more advanced concepts, so let’s start
from essentials topics before moving to concrete examples and implementations in
Open Layers library.
We will cover:
- Geographic Data Model Types
- “Layering” Model
- Types of GIS services
- Projections
- Scales and resolutions
Geographic Data Model Types
I will focus only on spatial reference data: there is 2 types : vector data type and raster data type.
Vector Data
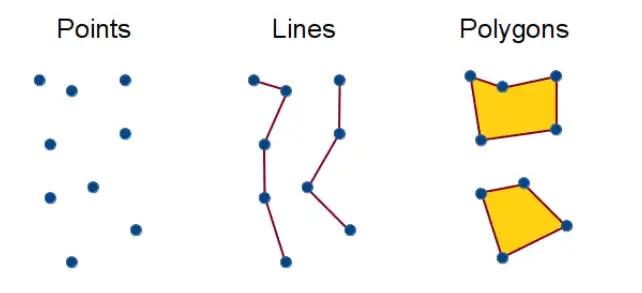
The vector data type represents objects on map by collection of coordinates. It’s can be:
- point : defined as 2 coordinates x and y
- line : defined as collection of points
- polygon : defined as collection of points where first point is the same as last point (for valid closed polygons).
Vector data can be used for example to represent buildings and streets on the map. Vector data is composed in vector layers, where each layer can be below or on top of another vector layer like paper pile. It’s up to you to decide what each layer will contain. For example you can have one layer to represent buildings and one layer to represent streets. In this case you have possibility to hide/show buildings and streets independently one of another on the map.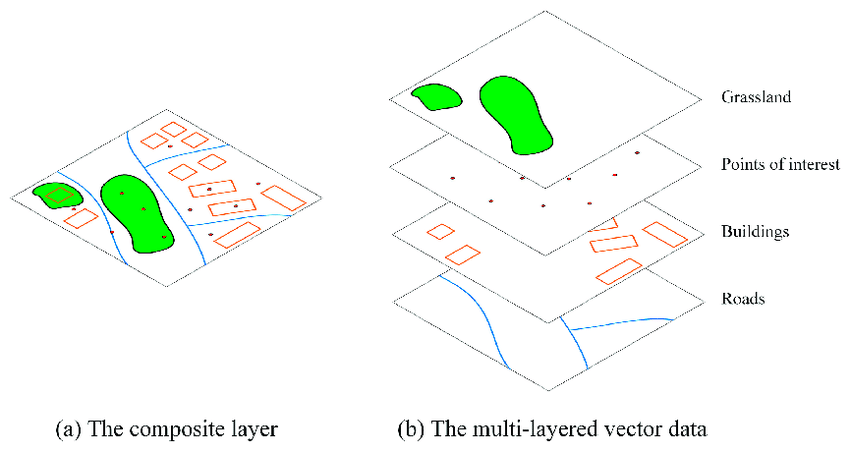
Each vector layer is composed of collection of vector features. For example take post office on the map: it will be a one feature from buildings vector layer. This one building has geographical location: geometry of feature as point or polygon and some additional info like building name, hours or opening/closing : properties of feature.
The most common format to represent vector source data is a GeoJSON. It contains a list of features named “FeatureCollection” where each feature is an object with geometry and properties of this feature. The source of vector data can be a static file on your computer or it can be dynamic response from your server which return GeoJSON depending on some incoming query parameters.
{
	"type" : "FeatureCollection",
	"features" : [
    {
      "type": "Feature",
      "geometry": {
        "type": "Point",
        "coordinates": [125.6, 10.1]
      },
      "properties": {
        "name": "Post Office",
        "hours" : [
          {
            "Monday": [
              {"start": "09:00", "finish": "18:00"}
            ]
          }
        ]
      }
    },
    {
      "type": "Feature",
      "geometry": {...},
      "properties": {...}
    }
  ]
}{
"type" : "FeatureCollection",
"features" : [
{
"type": "Feature",
"geometry": {
"type": "Point",
"coordinates": [125.6, 10.1]
},
"properties": {
"name": "Post Office",
"hours" : [
{
"Monday": [
{"start": "09:00", "finish": "18:00"}
]
}
]
}
},
{
"type": "Feature",
"geometry": {...},
"properties": {...}
}
]
}When using vector data with library like OpenLayers that we’ll see later, you can define the styles like colors, fills, strokes, labels etc for every feature independently or style all features of vector layer globally. You can even interact with your feature on map by selecting, rotating or translating. Vector layers are highly customisable because in the essence it’s a bunch of numbers and texts that we can modify.
Raster Data
On another side we have raster data represented by images.
In general, raster data is used to represent earth surface or some climat weather changes (sky) from space, like high quality and precision photos taken by drone or satellite.
 Example orthophoto
Unlike vector data, raster is collection of pixels, so you can’t change or interact with it directly.
Map Services
Often raster data represents some very large surface.
Loading all data in only one image will be almost impossible, because of it’s size but also because no one image can contains all details that we need from start. So raster data is mostly divided in collection of squares named “tiles” of the same size (for example 256 x 256 px) but with different level of details and zoom. The better is to think about tiles as a pyramid in a 3 dimensional space, where the top of the pyramid is a tile covering all surface (minimal zoom) with very little details (like the world map with pins on the wall in your grandma house). And the bottom of pyramid is a maximum zoom where you can see different buildings streets etc.
When you go from top of pyramid to the bottom you increase your zoom levels.
Usually with each zoom level increase, the number of tiles for next level of zoom is mutiplied by 4 to cover same surface as previous level of zoom. So we have :
- 1 tile for zoom level 0
- 4 tiles for zoom level 1
- 16 for zoom level 2
- 64 for level 3 and so on.
Each tile has 3 coordinate to identify it in “pyramid”: z for zoom level and x, y for row and column on it’s zoom level. For example the tile on the top of Pyramid will have coordinate: 0,1,1 because it’s a zoom level 0 and it’s the only tile for this level of zoom (first in a row and first in a column). These tiles are usually pre generated and saved on server as static images so it offers a better performance, but less flexibility. When client request tile with x,y,z coordinates the server search image on hard disk in corresponding folder and return it to the client. This type of server called TMS (Tile Map Service) with XYZ source.
"https://example.com/tiles/landcover/EPSG:4326/5/15/10.png""https://example.com/tiles/landcover/EPSG:4326/5/15/10.png"Raster data can also represent a small portion of surface limited by some geometry. This geometry restriction called extent or bbox and it’s represent 4 values of rectangle (minX, minY, maxX, maxY) which define visible part of image we will obtain.
There is another type of service which delivers raster data and it’s called WMS service. Both TMS and WMS serve for sending map images to client. The difference between them is that WMS generate image dynamically on each client request and so more flexible in term of what can be do, while TMS returns prerendered static images. So there is a flexibility-performance trade-offs to take in account if you choose between two services. Also you can combine and use both of them for different layers on map.
As I said WMS can generate image on each client request: for example client requests image for OSM (OpenStreetMap) layer limited to some geometry accordingly to WMS standard, the server then generate image on request (if layer id is known by this WMS) and return image in requested format limited by requested bbox and transparent background to the client. You can then stack this images on top of each other to represent different layers of map together. WMS standard for each service is defined by it’s GetCapabilities xml document which you can query before query images.
https://ows.terrestris.de/osm/service?
REQUEST=GetMap&
SERVICE=WMS&
VERSION=1.3.0&
LAYERS=OSM-WMS&
STYLES=&
CRS=EPSG:4326&
BBOX=51.49451,-0.11377,51.53267,-0.06971&
WIDTH=400&
HEIGHT=300&
FORMAT=image/png&
TRANSPARENT=TRUEhttps://ows.terrestris.de/osm/service?
REQUEST=GetMap&
SERVICE=WMS&
VERSION=1.3.0&
LAYERS=OSM-WMS&
STYLES=&
CRS=EPSG:4326&
BBOX=51.49451,-0.11377,51.53267,-0.06971&
WIDTH=400&
HEIGHT=300&
FORMAT=image/png&
TRANSPARENT=TRUEAs for vector layers, you can have multiple raster layers on your map, but unlike features from vector layer, you can’t divide one tile in two separate raster layers because it’s a continuous pixelised image.
Also you can’t change styling of raster layer on the client side of application: you need to send new request with updated query parameter STYLES to get new image from the WMS server which will replace the previous one. The most common formats of raster data are png/jpeg image.
There is also another service called WMTS. It gives the same results as TMS service (the tiles) but with WMS specification. In the case of TMS service you have to provide tile coordinates in XYZ format, while for WMTS service you starting from query service definitions in xml format (GetCapabilities) as for WMS service. Xml definition allows to define parameters like tile size, resolutions, projection etc. Then you can query service tiles by providing tile parameters, like tileMatrix (zoom), tileRow (X) and tileColumn (Y).
Quick Summarize
Remember that order of layers on map is important and think of it as a pile of papers: if we first adding a raster layer on the map and then adding vector layer on the map after raster layer, it’s the vector layer that will be visible on top of the raster layer by default.
In GIS software map data is composed in data layers like paper pile.
There is 2 types of gis data : vector and raster.
Vector data served to http client mostly through API as GeoJSON objects.
Raster data served to http client mostly through 3 services:
- WMS : generate image on each client request (more flexibility, less performance)
- TMS : return prerendered static images from service (more performance, less flexibility)
- WMTS : same as TMS but based on specifications as WMS (XML GetCapabilities)
Conclusion
I divided the basics in 2 parts, so in the next part, we will discover what is map projections, resolutions and scales. Stay tuned!
Sources
https://www.researchgate.net/
https://levelup.gitconnected.com/a-geographic-microservice-d7634bd060ac
https://www.maptiler.com/
https://desktop.arcgis.com/
https://www.esri.com/
https://mapscaping.com/difference-between-wmts-and-wms/